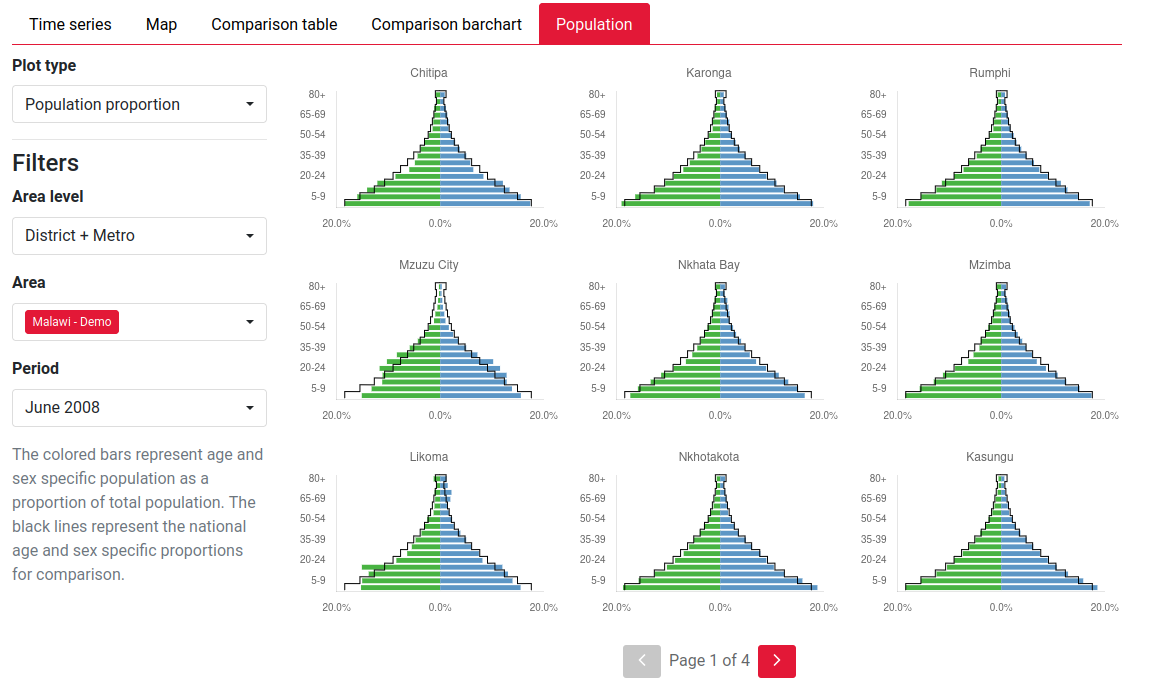
Two new plots have been added into Naomi interface. The first is a new input review plot which shows population pyramids for every region in the area hierarchy. Data for this will be aggregated from the lowest level available in the uploaded population file. You can view numbers or the proportion. When viewing proportion, the aggregated country level population proportions are shown with a black line.

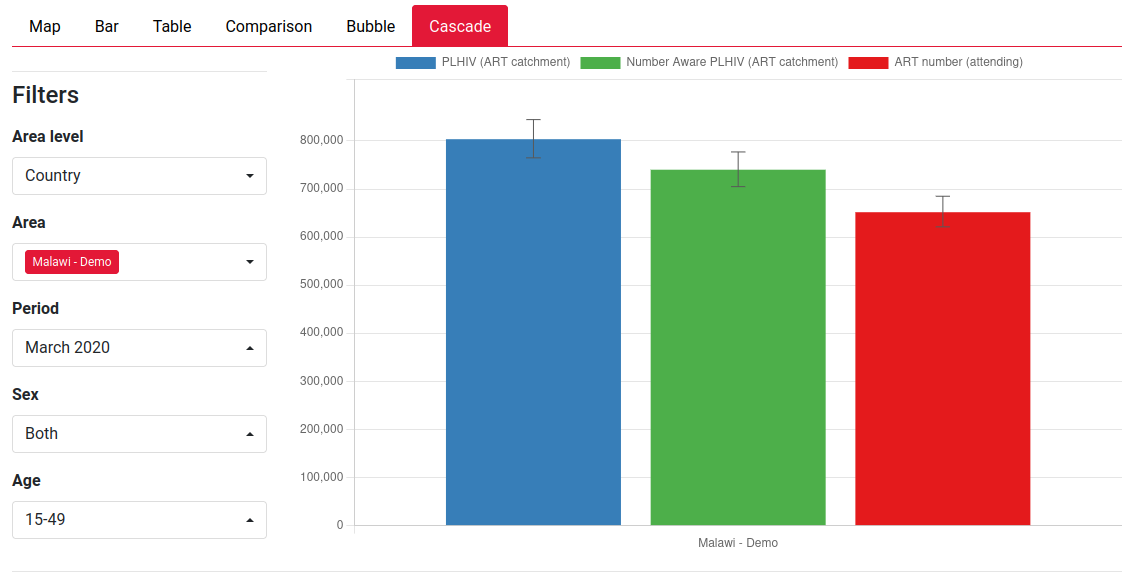
You can also now see cascade plot of the first two items in the 95-95-95 treatment cascade. You can see the PLHIV, Number aware of their status and of those, the number on ART. At the moment, this shows the raw numbers from the model simulation. In the future, we will add a view showing proportions.
