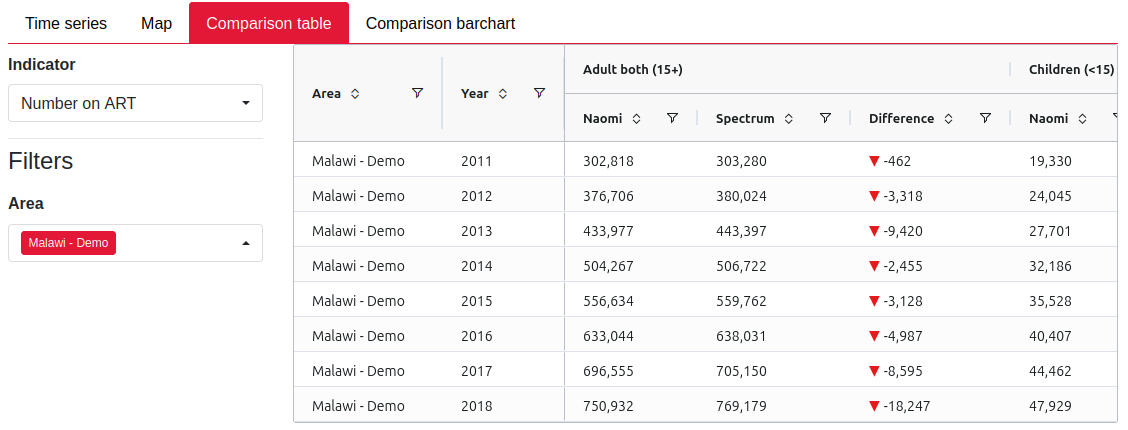
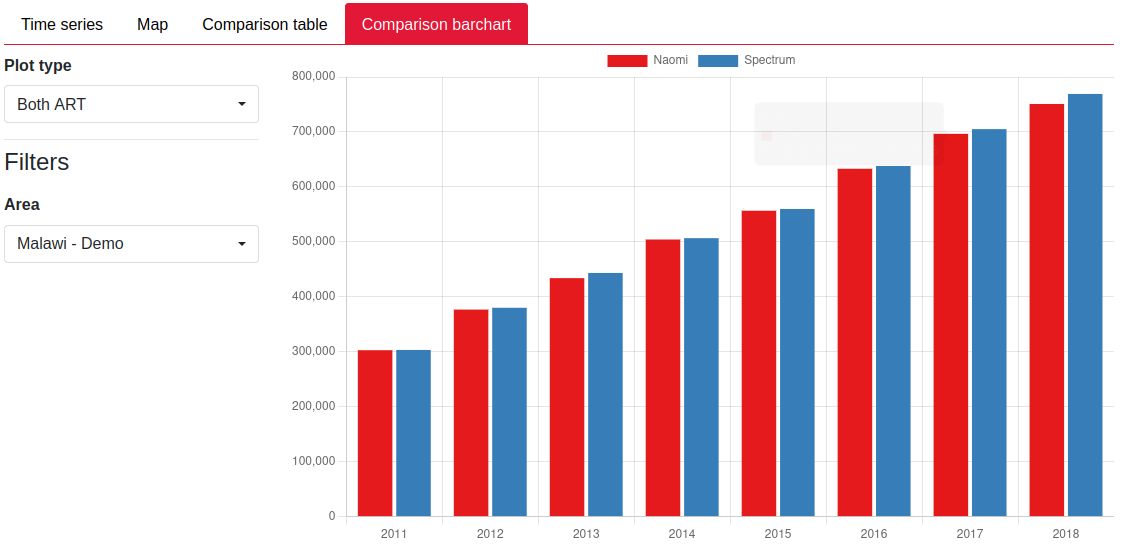
We’ve added a two new input review plots into Naomi.
You can now review a comparison of Spectrum to Naomi input data. This plot shows the numbers from the input ANC and ART files aggregated to the same level as the Spectrum file. Use this to inspect any differences between input numbers to identify potential data quality issues.

